Making 'The Retired'
October 9, 2020
One year ago, in October 2019, the U.S. was experiencing one of the most active hurricane seasons of the last 50 years. Hurricanes are named alphabetically after people (Bob, Olga, etc.), and as we quickly exhausted the A, B, C’s and got into the L, M, N, O, P’s, I started to wonder exactly how these names were decided. I researched the tumultuous past of hurricane naming, learned how our modern system uses six lists that recycle, and how particularly damaging storms are “retired” so the name is taken out of circulation. Eventually, I followed the trail of breadcrumbs on Wikipedia to a page called “List of Retired Atlantic Hurricane Names”. The page was filled with tables containing all sorts of statistics on all retired storms in Atlantic history, and I dove in like a kid on Christmas morning.
See the project ↗
The data
This project grew organically. I took those tables from Wikipedia, cleaned them up, filled in any gaps in the data, and let it take me where it would. I made some quick simple charts, and began to absorb the data, looking for interesting stories or surprising outliers.
For anyone wondering, I don’t see any problem with using Wikipedia here. The tables on Wikipedia were compiled from hundreds of different news stories and governmental or scientific reports. Every entry was referenced back to the original source(s) and only primary sources were used. When I ended up publishing the story with Scientific American, I did go through and verify each entry, going back to the primary sources, and I was able to confirm the accuracy of the data. Gone are the days of Wikipedia as a wild-west of information, I now see it as a reliable research resource (assuming you read with a skeptical eye, as you should with any source).
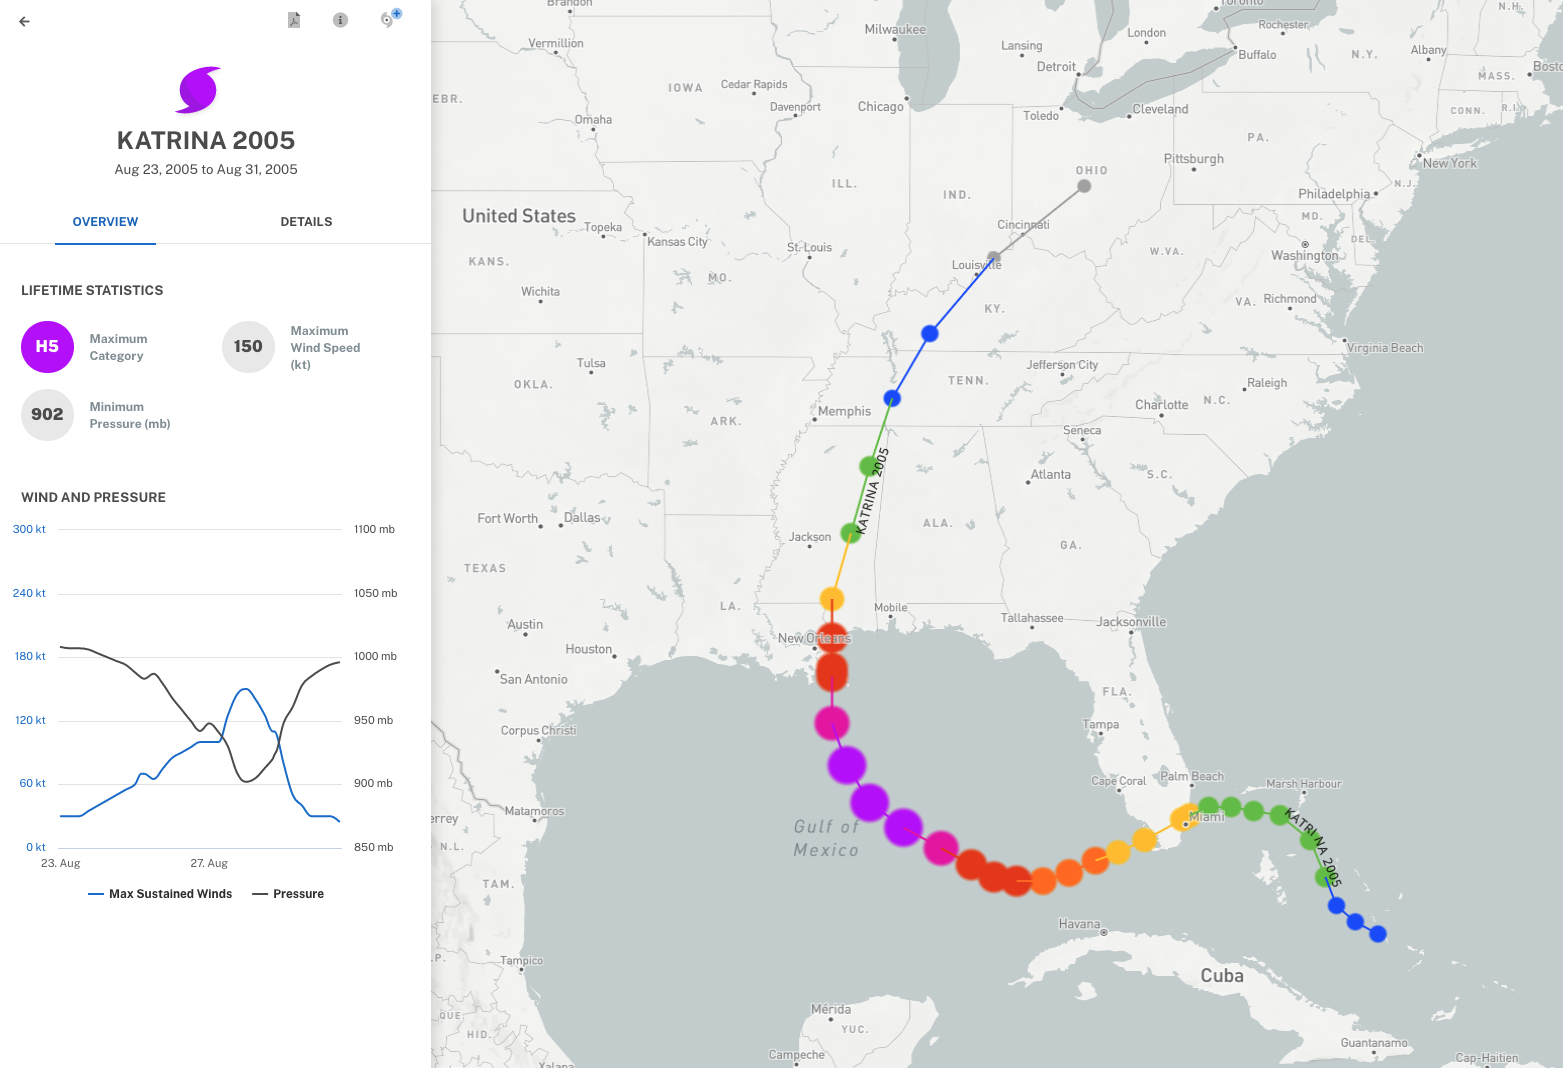
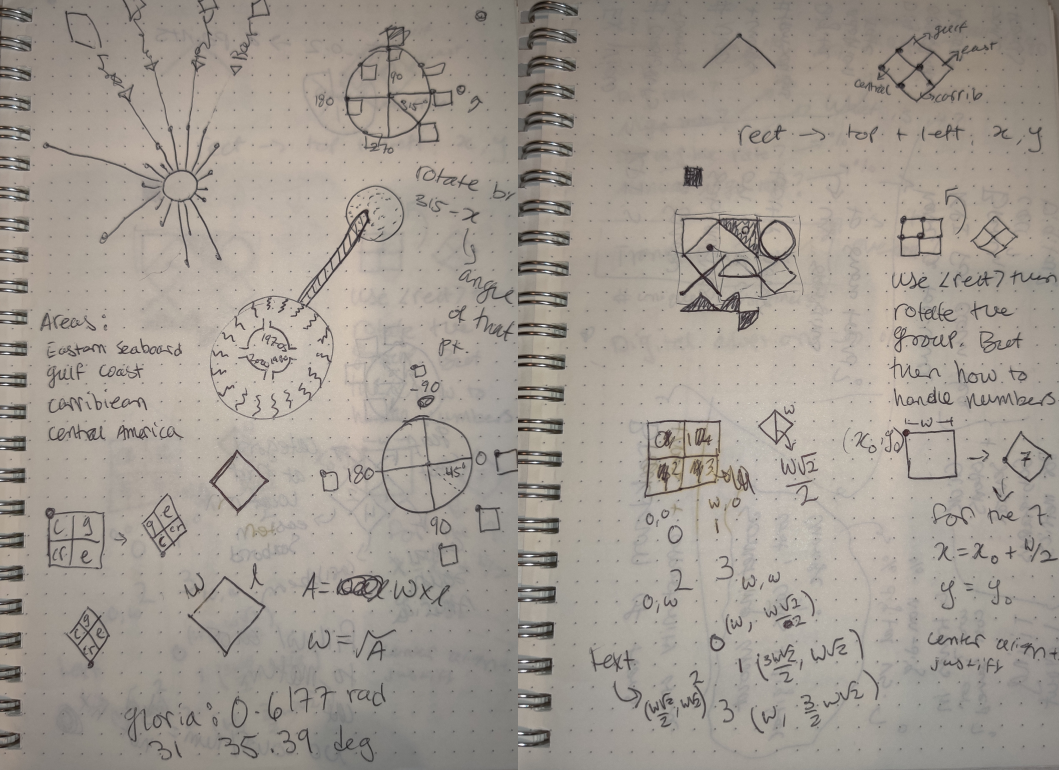
The more time I spent with the data, the more I realized just using the peak category of a hurricane was misleading—what really matters is what category the hurricane was when it made landfall. But this was problematic because several hurricanes make landfall more than once in different areas (ie. hurricanes that hit the Carribbean and then the Gulf Coast). My solution was for each hurricane, I recorded the category as it made landfall in each of four major regions affected by Atlantic hurricanes: the Eastern seaboard, the Gulf Coast, the Carribbean, and Mexico and Central America. I’m sure some very smart programmer could have written a script to do this, but I figured it would be easier to just record the values by hand. NOAA has a very nice hurricane database that made this relatively simple, if a bit tedious. But I find this type of slow manual data collection quite relaxing and enjoyable, so it made the perfect activity to work on while at my parent’s house for Christmas vacation.
Overall design and layout
The data and the design of this project co-evolved like a pair of symbiotic organisms, each change in one partner prompting the other to grow and morph in response. The initial layout of a radial chart was inspired by the shape of a hurricane. The visual metaphor was rather obvious: a radial graphic is round like a hurricane (duh), it has a hole in the center like the eye of a hurricane, and I could encode data as bars reaching out like the arms of a hurricane. As is my process with any new visual, I started matching data to visual encoding. Each storm would be represented around the circle in chronological order. Damage caused and deaths are the primary factors in deciding if a storm will be retired, so I encoded those prominently: damage as the length of the arms in each segment, and at the tip of each arm a circle proportional to the deaths. Here came the first evolution: my initial sketches had the arms curved to represent the vortex structure of a hurricane, but when I plugged in the data it looked more like a creepy spider than a swirling vortex, so the design evolved to use straight arms.
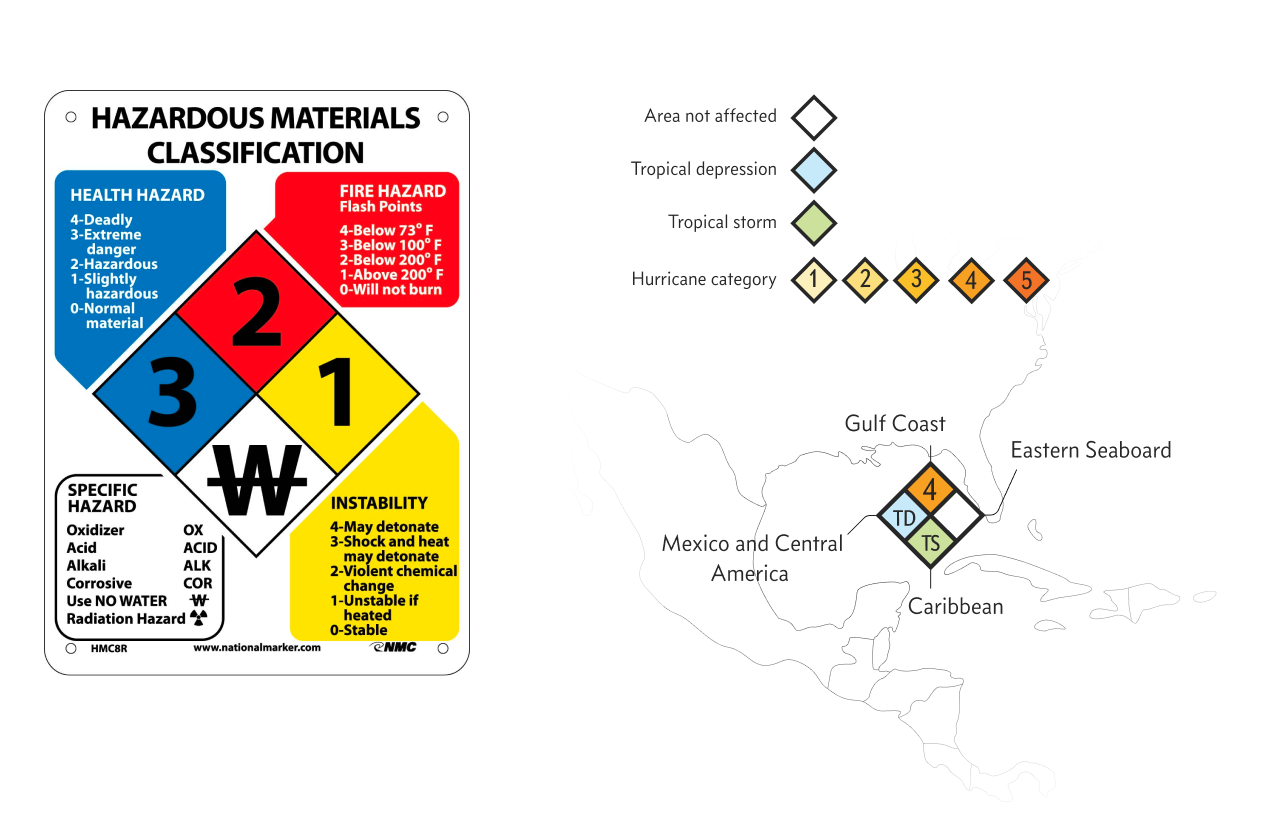
It was a good start, but rather sparse and uninteresting, so I looked at what other data I could incorporate. I had wind speed, but yet another continuous variable (we already had damage and deaths) would be overwhelming, so I settled on hurricane category, which is really just a binned form of wind speed. At this point I realized that hurricanes may affect various areas, and decided that instead of just the peak category, I needed the category when the storm made landfall in one of four regions (as discussed above). I had planned to put the category information as colored symbols on the outer ring, but now in the same amount of space I had four times the amount of information to communicate, and a geospatial component to add. My solution was inspired by my background as a scientist, where I worked with hazardous chemicals. I took the four-quadrant diamond icon from the MSDS hazardous materials classification, and adapted it to show the strength of the hurricanes in each region, with a natural mapping to the spatial categorization. The second evolution was complete.
The final evolution was a case of design influencing the data. By now the layout was coming together, but the empty circle in the middle (the eye of the hurricane) was still too large, it was a gaping void of empty space that made the whole composition feel unbalanced. As I thought about what could fit that space, it struck me that there was still a lack of connection between the story of hurricane naming and the destructiveness stats I was reporting. The solution was simple: for each storm I recorded all of the previous occurrences of that name and represented each previous usage as diamonds along a line pointing inwards. This shows how some storm names were retired after just a single use, while others (like Florence) were used repeatedly. It also shows the six-year recycling system introduced in the 70s; storms before this point show erratic spacing, while after this the points are evenly spaced, reflecting the recycling structure.
UX design
Radial graphics always work better in print; on the web, the whole experience falls a little flat. Usually you have to zoom in to see the detail, but then you can only see a small portion, you may have to pan around, losing the larger context, and you will inevitably strain your neck struggling to read text upside down or sideways. I looked at all these issues and thought we can do better. It would have been easier to just make this a static infographic, but I thought making it web-native would be fun, so I set myself a challenge: make a radial graphic that is responsive and easy to read on any screen size (yes, including mobile).
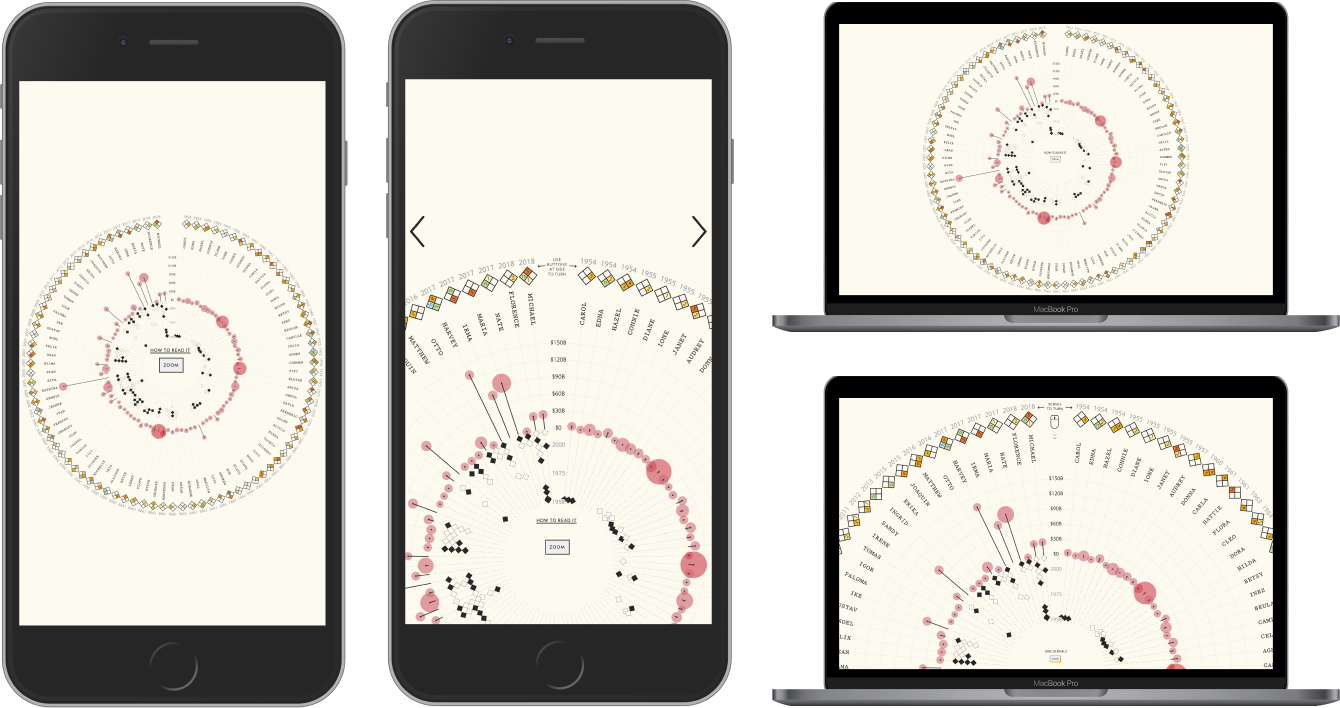
The responsive part was fairly easy (well, it was easy to design, not to code). The graphic resizes so that on screens that are wider than they are tall the graphic fills the height, and when a screen is taller than it is wide, the graphic fills the width. The more difficult problem is how to replicate the experience of a print graphic that you can pick up, inspect more closely, and rotate the whole page, easily reading each entry. I tackled this by having two modes: when you first encounter the graphic it fills the page, but when you click a ‘zoom’ button it zooms in so that roughly the top half of the graphic fills the screen, making the entries easier to read. In the zoomed mode, you can rotate the whole graphic using your mouse wheel or arrow keys (on desktop) and a set of buttons on mobile.
I’m really proud of this solution. It was an absolute beast to code, but I think the experience is worth it. I don’t know if I’m the first one to do something like this, but I can’t find any other examples that go so far to make a radial graphic as easy to read on the web. And with all said and done, I think I achieved my goal of making an experience that is equally enjoyable (or more-so) on the web as it is in print.
Typography and color
The visual identity was inspired by two sources: vintage hurricane tracking charts from the 50s and 60s, and the old government reports I read while researching hurricane stats. The hurricane charts often featured geometric futura-esque fonts, which inspired Concourse, the primary type used in charts. Concourse has an undeniable mid-century vibe, and the roundness of the letterforms reflect the shape of the circular graphic. Advocate is used for display, with the straight lines, right angles, and squared off terminals pairing well with the geometry of Concourse. Equity gives a trustworthy voice to the body copy, while Triplicate—a font inspired by vintage typewriters—is used for the names of the retired hurricanes, echoing the government reports I referenced.
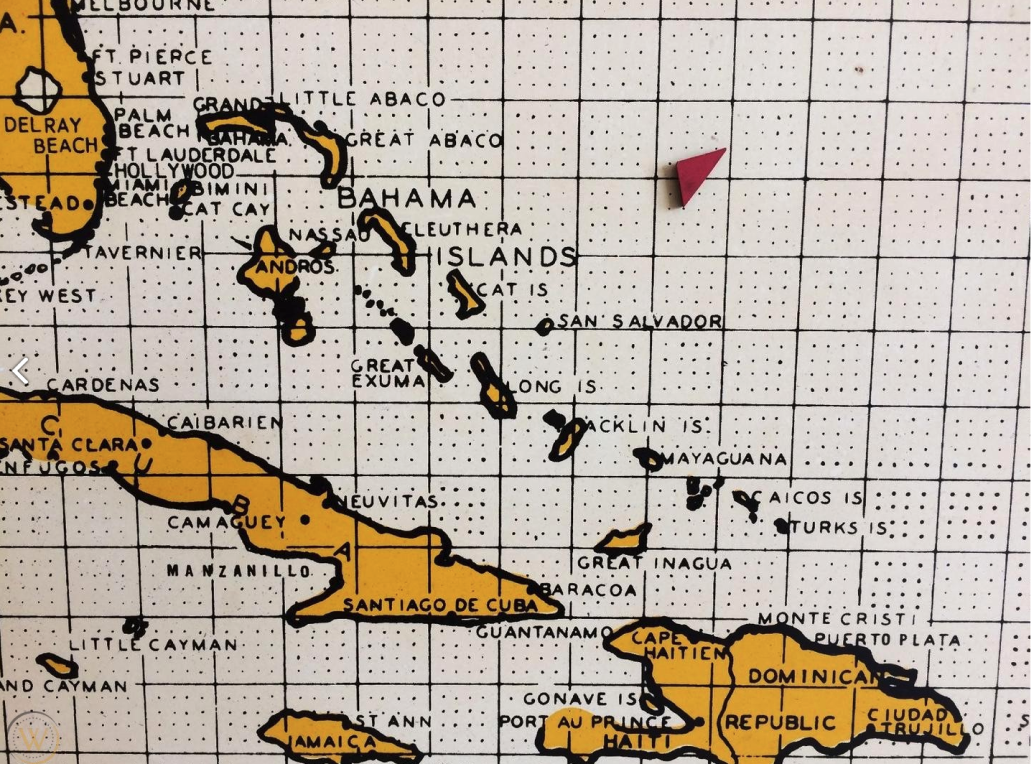
The vintage hurricane charts inspired the primary color palette of black with yellow accents. The background of these charts was typically grey, but I swapped that with a cream color lifted from the yellowing paper of old government reports. Hurricane severity in charts is denoted with a yellow to red palette, with a pale blue and green denoting less severe storms. The color palette references those found in weather reports, but pares down the palette quite a bit to avoid the rainbow explosion so often seen on the news.
Code
I can’t go through the code for this entire project, but I do want to touch on a few key pieces. The whole thing is coded with just HTML, CSS, vanilla JavaScript, and D3. I don’t have anything against frameworks or fancy build processes, but web development in 2020 can be quite intimidating, and it’s easy to get overwhelmed feeling like you need to be an expert in dozens of technologies before you can even start. This project is my way of saying you can make a damn cool website without frameworks, without webpack, and without preprocessors, backends, or APIs. So next time you’re intimidated by all the upfront junk, just open your three files in a text editor, and go to work.
To achieve the zoom I use an HTML structure with two wrapper divs around the SVG element. The SVG is set to fill the inner wrapper using the padding-bottom trick so that it is responsive to the screen size. The outer wrapper is normally set to just be 100% width, so when zoomed out it has no effect, but when zoomed in I increase the width of the outer wrapper to be twice the window width, and pull it to the center by adjusting the left margins. This has the effect of “zooming”, but of course we also have to hide the overflow and remove the ability to scroll. This is the heart of the idea, but of course in reality there’s about 300 lines of code to account for all the possible scenarios*.
The rotation is decidedly simpler than the zooming. We just attach an event listener to the wheel event when zoomed in that rotates the entire SVG element using transform: rotate. A couple of extra bits are added to account for mobile and keyboard users, and importantly, the event is throttled using lodash’s throttle function to prevent the rotation from going too fast (a common issue with mouse wheels).
Bringing ‘The Retired’ into the physical world
Once I had a working prototype, I pitched this project to Jen Christiansen at Scientific American magazine. I always thought the main radial graphic would work well as a one-page graphic feature, and Jen agreed. We moved forward, tweaking the graphic for print, and sprucing up the interactive version. Jen gave some excellent art direction, and provided invaluable help adapting the graphic for print.
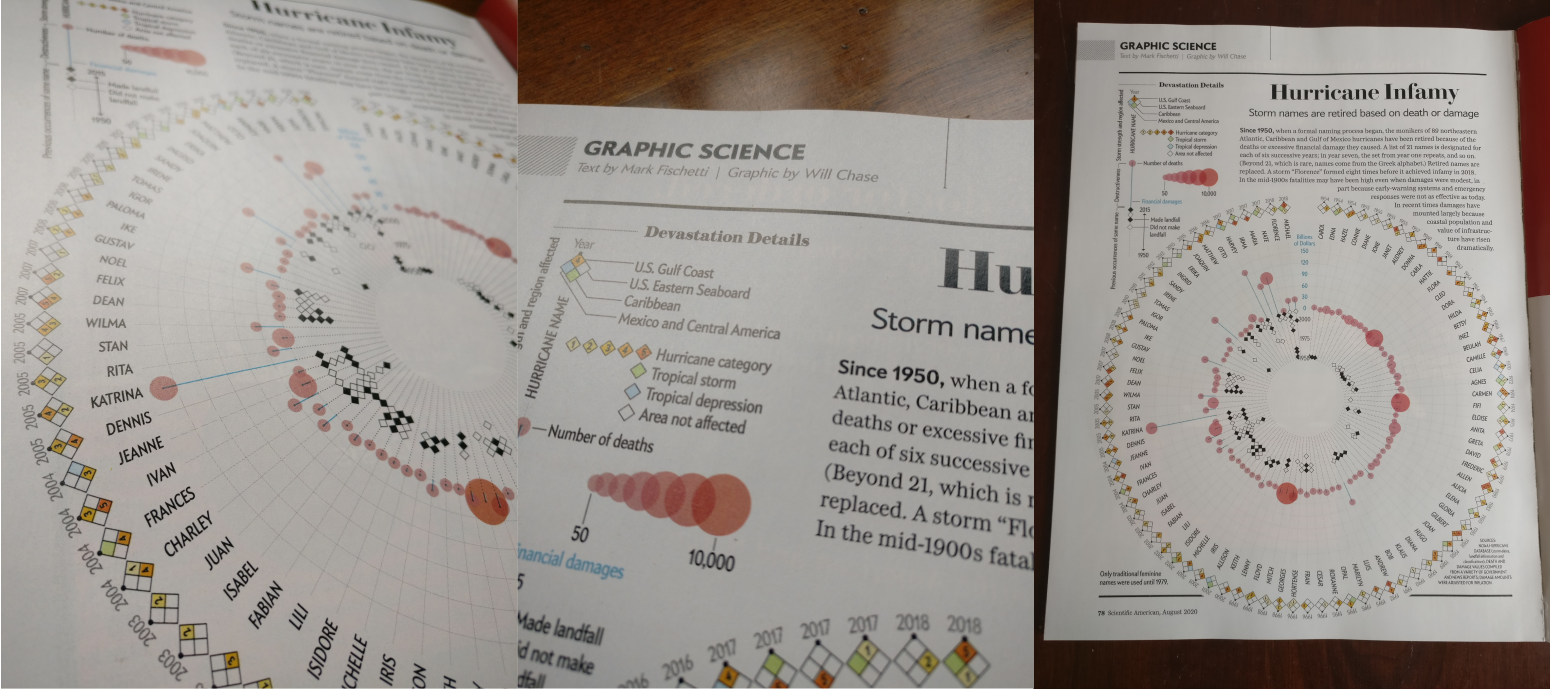
The print version appeared in the August 2020 issue of the magazine, and it was a special moment for me to see both my first byline in an official popular publication*, and my first print graphic. I prepared the interactive version for launch around this time as well, but Scientific American was short on web developers, and I imagine this small feature was not a huge priority so unfortunately it was never published online (although the static version did appear on their website). But luckily, SA has a very fair contract that allows me to publish the work on my own platforms after an exclusivity period, which is now expired, so the original web-based version can now see the light of day.
I had so much fun with this whole project, I really can’t believe it’s been an entire year since I started, it feels like the time flew by. I hope you enjoy reading it as much as I enjoyed making it.